Simple Gantt Charts in LaTeX
Gantt charts are often required in grant applications and similar project descriptions. Simple ones can be produced using a spreadsheet. Complex ones can be produced using MS Project, or its open source alternative Project Libre (which is installed in TCM).
In LaTeX the two main options are to use the pgfgantt package, which is very fully featured, or just to use the tabular environment for a simple chart. This page has some suggestions on the latter route.
The Simple Result

And the source.
Commentary
This solution uses the packages xcolor, colortbl and forloop, the latter being a convenience for setting multiple cells at once. It then defines some convenience macros for setting those multiple cells at once.
\usepackage{forloop}
\newcounter{loopcntr}
\newcommand{\rpt}[2][1]{%
  \forloop{loopcntr}{0}{\value{loopcntr}<#1}{#2}%
}
\newcommand{\on}[1][1]{
  \forloop{loopcntr}{0}{\value{loopcntr}<#1}{&\cellcolor{gray}}
}
\newcommand{\off}[1][1]{
  \forloop{loopcntr}{0}{\value{loopcntr}<#1}{&}
}
With this in place, the table is simply defined as
\noindent\begin{tabular}{p{0.17\textwidth}*{20}{|p{0.01\textwidth}}|}
The \noindent reduces the indentation of the table,
and then one has one wide column, followed by twenty narrow
columns. Other units of measure could have been used, such as
1in rather than 0.17\textwidth. Note that
column separation gaps will means that the table is a lot wider than
the sum of the column widths.
The top line of the table is then generated by
\textbf{Gantt chart} & \multicolumn{4}{c|}{Year 1}
           & \multicolumn{4}{c|}{Year 2}
           & \multicolumn{4}{c|}{Year 3}
           & \multicolumn{4}{c|}{Year 4}
           & \multicolumn{4}{c|}{Year 5} \\
and for the next line we make use of the rpt macro we
have defined to repeat its argument five times
\rpt[5]{& 1 & 2 & 3 & 4} \\
After this, individual entries are quite straight-forward, with lines such as
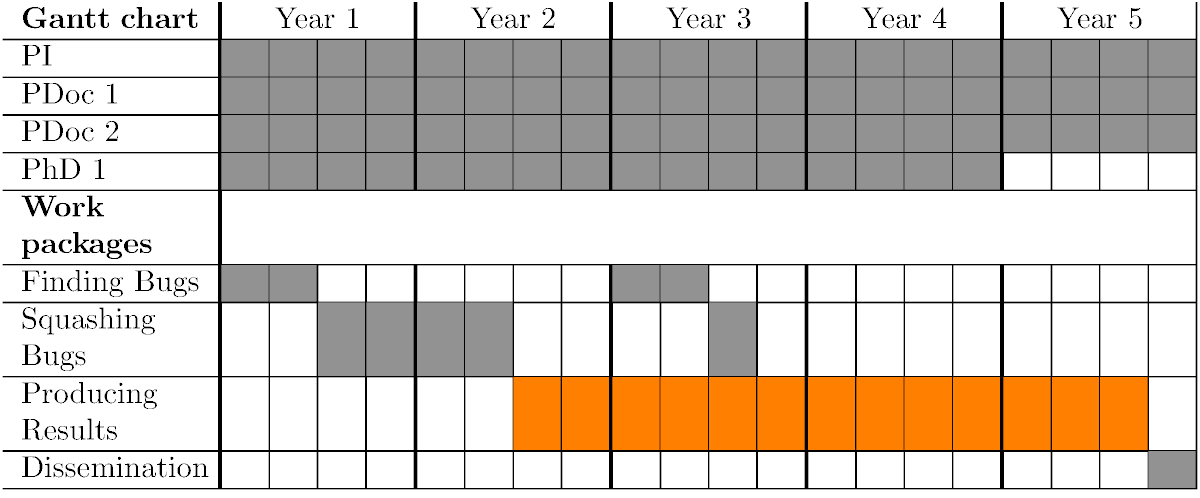
PhD 1     \on[16] \off[4]\\
\hline
and
Squashing Bugs \off[2] \on[4] \off[4] \on[1] \off[9] \\
\hline
The only remaining trick is removing the column separators from the work packages line, whilst keeping the vertical line at the right-hand side. This was done with
\textbf{Work \mbox{packages}} & \multicolumn{20}{c|}{} \\
Possible improvements
Colours
The colour can readily be changed, either for all cells by changing
the "gray" in the definition of the on macro, or for
some cells by defining a second on macro, called
something like onx (remember digits cannot be a part of
macro names), with a different colour specification. Colours
guaranteed to exist are black, blue, brown, cyan, darkgray, gray,
green, lightgray, lime, magenta, olive, orange, pink, purple, red,
teal, violet, white and yellow, and one can add others in the usual
way (the following three lines are equivalent):
\definecolor{orange}{rgb}{1,0.5,0}
\definecolor{orange}{RGB}{255,127,0}
\definecolor{orange}{HTML}{FF7F00}
Thicker vertical lines dividing years
Unfortunately our rpt macro does not work in the
columns specification of tabular, so one is left
writing something like
\noindent\begin{tabular}{p{0.17\textwidth}
!{\vrule width 0.4mm}p{0.01\textwidth}*{3}{|p{0.01\textwidth}}
!{\vrule width 0.4mm}p{0.01\textwidth}*{3}{|p{0.01\textwidth}}
!{\vrule width 0.4mm}p{0.01\textwidth}*{3}{|p{0.01\textwidth}}
!{\vrule width 0.4mm}p{0.01\textwidth}*{3}{|p{0.01\textwidth}}
!{\vrule width 0.4mm}p{0.01\textwidth}*{3}{|p{0.01\textwidth}}
|}
% The top line
\textbf{Gantt chart} & \multicolumn{4}{c!{\vrule width 0.4mm}}{Year 1}
           & \multicolumn{4}{c!{\vrule width 0.4mm}}{Year 2}
           & \multicolumn{4}{c!{\vrule width 0.4mm}}{Year 3}
           & \multicolumn{4}{c!{\vrule width 0.4mm}}{Year 4}
           & \multicolumn{4}{c|}{Year 5} \\
Thank goodness for copy and paste! The rest of the table is unchanged.
Improved Result
And the source.